POTENTIOMETRIC TITRATIONS
The titrations which involve the measurement of electrode potentials with the addition of the titrant, are called potentiometric titrations.
Generally, potentiometric titrations fall into the following three categories---
(1). Acid-Base Titrations
(2). Redox Titrations or Oxidation-Reduction Titrations
(3). Precipitation Titrations
Acid-Base Titrations
Suppose an acid (say, HCl) is to be titrated with a base (say, NaOH). In the HCl solution is inserted a hydrogen electrode and this is coupled with a reference electrode, such as calomel electrode. So, the galvanic cell may be represented as---
Pt, H2 (1 atm) | H+ || KCl sat. soln; Hg2Cl2 (s) | Hg
So, the EMF of the cell---
E = Ecalomel – Ehydrogen
= 0.2422 – 0.0591 log [H+] (at 250C)
= 0.2422 + 0.0591 PH
Suppose 100 ml of 0.1 M HCl solution is to be titrated against the titrant 1 M NaOH solution. With the successive addition of alkali, the concentration of H+ goes on decreasing. So, the PH of the solution goes on increasing and also EMF of the cell goes on increasing. It is found that, the EMF of the cell would increase by 0.0591 volt for every 10-fold decrease in the concentration of H+ ions or increase in the PH of the solution by one unit.
Assuming that, there is no change in volume during the titration, it is found that, for the addition of first 9 ml of titrant NaOH, will give a change of 0.0591 volt. However, for the addition of next 0.9 ml of titrant NaOH, will produce the same change, and also for the addition of next 0.9 ml of titrant NaOH, will produce the same change and so on. So, the EMF of the cell changes slowly at first but more and more rapidly as the end point approaches.
Further addition of titrant NaOH solution, after the end point produces very little change in the H+ ion concentration. So, there is very little change in the EMF of the cell.
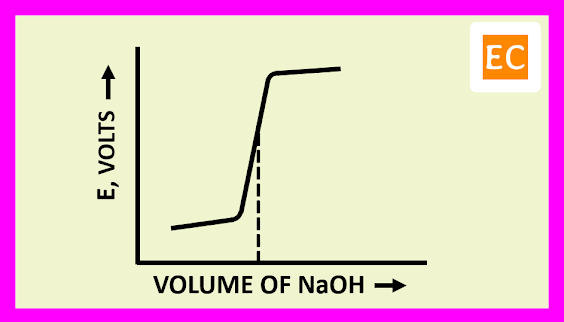
The plot of E against the volume of titrant NaOH is shown in the figure---
The EMF of the cell initially rises gradually, after that more rapidly near the equivalence point. After the equivalence point, the EMF of the cell again increases slightly on adding more of NaOH.
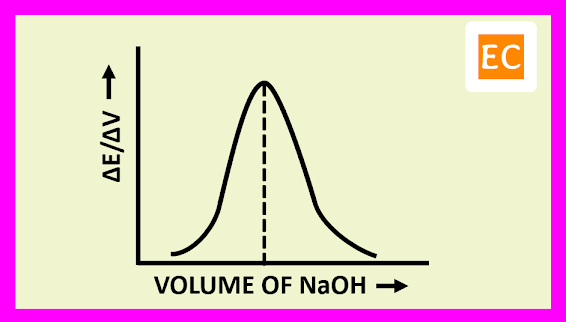
The plot of (ΔE/ΔV) against the volume of titrant NaOH is shown in the figure---
At the equivalence point, the resulting curve rises to a maximum. The volume of the titrant NaOH solution, at the equivalence point is determined by drawing a vertical line from the peak to the volume axis.
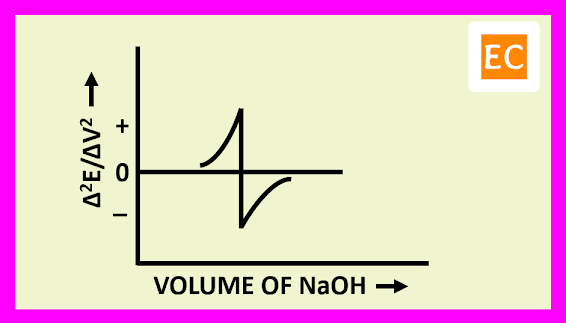
The plot of (Δ2E/ΔV2) against the volume of titrant NaOH is shown in the figure---
The derivation of the slope is zero, at the point where the slope ΔE/ΔV is a maximum. By drawing a vertical line from the point at which Δ2E/ΔV2 is zero on the volume axis, the equivalence point is determined.
Redox Titrations or Oxidation-Reduction Titrations
Let us consider the titration of an acidified ferrous sulphate solution with an oxidising agent, say a dichromate solution. In a beaker, a known volume of ferrous sulphate solution is taken and a platinum wire is inserted in it. The titre dichromate solution is added from a burette. During the titration, at any instant, we have a mixture of Fe2+ and Fe3+ ions with a Pt-wire inserted in it, and this forms a reversible electrode. To form the cell, this electrode is coupled with a reference electrode, say a calomel electrode.
The galvanic cell is represented as---
Hg | HgCl2 (s), KCl (sat. soln.) || Fe2+ | Fe3+; Pt
So, the EMF of the cell---
E = Constant + 0.0591 log ([Fe3+] / [Fe2+]) (at 250C)
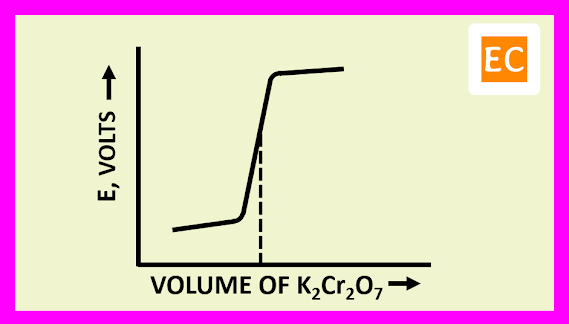
The progressive addition of titre, will cause a change in the EMF of the cell, as the ratio [Fe3+] / [Fe2+] increases. The Fe2+ ions concentration will be ultimately extremely small but not zero. When the EMF of the cell is plotted against the volume of titre added, the curve shows its greatest slope when the equivalence point is reached. Before the end point, the potentials are governed by the titrated system ([Fe3+] / [Fe2+]). After the equivalence point is passed, the potentials are governed by the titrant system ([Cr3+] / [Cr2O72-]).
The plot of E against the volume of titrant K2Cr2O7 is shown in the figure---
Precipitation Titrations
Consider the estimation of chlorides with silver nitrate solution by potentiometric titrations. In a beaker, a known volume of KCl solution is taken, in which is inserted a silver electrode, called an indicator electrode. The titrant AgNO3 is added from a burette in small amount. As a result, AgCl is formed as a precipitate. The reaction is---
Ag+ + NO3- + (K+ + Cl-) ------> AgCl (s) + K+ + NO3-
So, we have a reversible electrode Ag | AgCl(s)|Cl-. This electrode is coupled with a reference electrode, say a calomel electrode.
The cell is represented as---
Ag | AgCl(s) | Cl- || KCl sat. soln; Hg2Cl2(s) | Hg
So, the EMF of the cell---
E = Constant – 0.0591 log [Ag+] (at 250C)
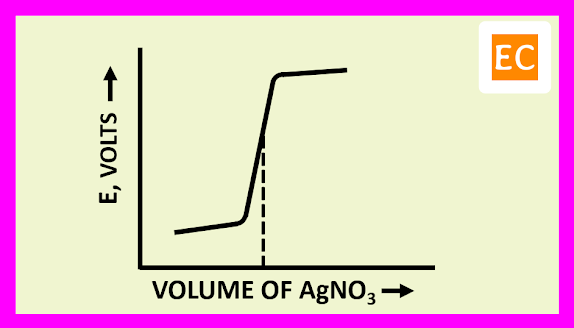
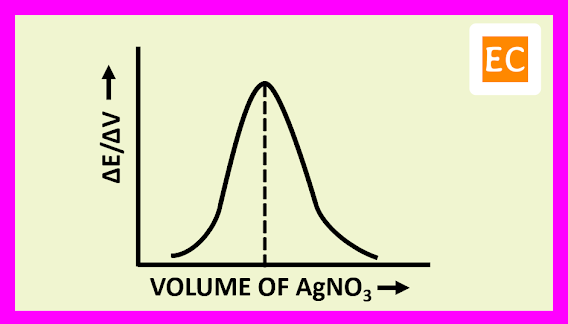
The solubility of AgCl is quite small, with the progress of the titration the concentration of Ag+ ions in solution will change very slightly, so the EMF of the cell will change but little. When the equivalence point is reached, the addition of a drop of AgNO3 would bring about a large increase in the Ag+ ion concentration, so the EMF of the cell change sharply. That is, when the sharp change in EMF is detected, the end point is reached.
The plot of E against the volume of titrant AgNO3 is shown in the figure---
The plot of (ΔE/ΔV) against the volume of titrant AgNO3 is shown in the figure---
